 FlightNoise24
About FlightNoise24
What is FlightNoise24?
FlightNoise24 estimates how much aircraft noise reaches the ground, anywhere in the world. It combines ADS-B flight data from the OpenSky Network with a physical noise model and shows the result on a map made of 200 × 200 m grid cells.
The position of each aircraft is recorded about every two minutes; the maps are calculated once per day (UTC), a few hours after the day ends. The current day is therefore never shown - the latest day on the map is always yesterday or the day before.
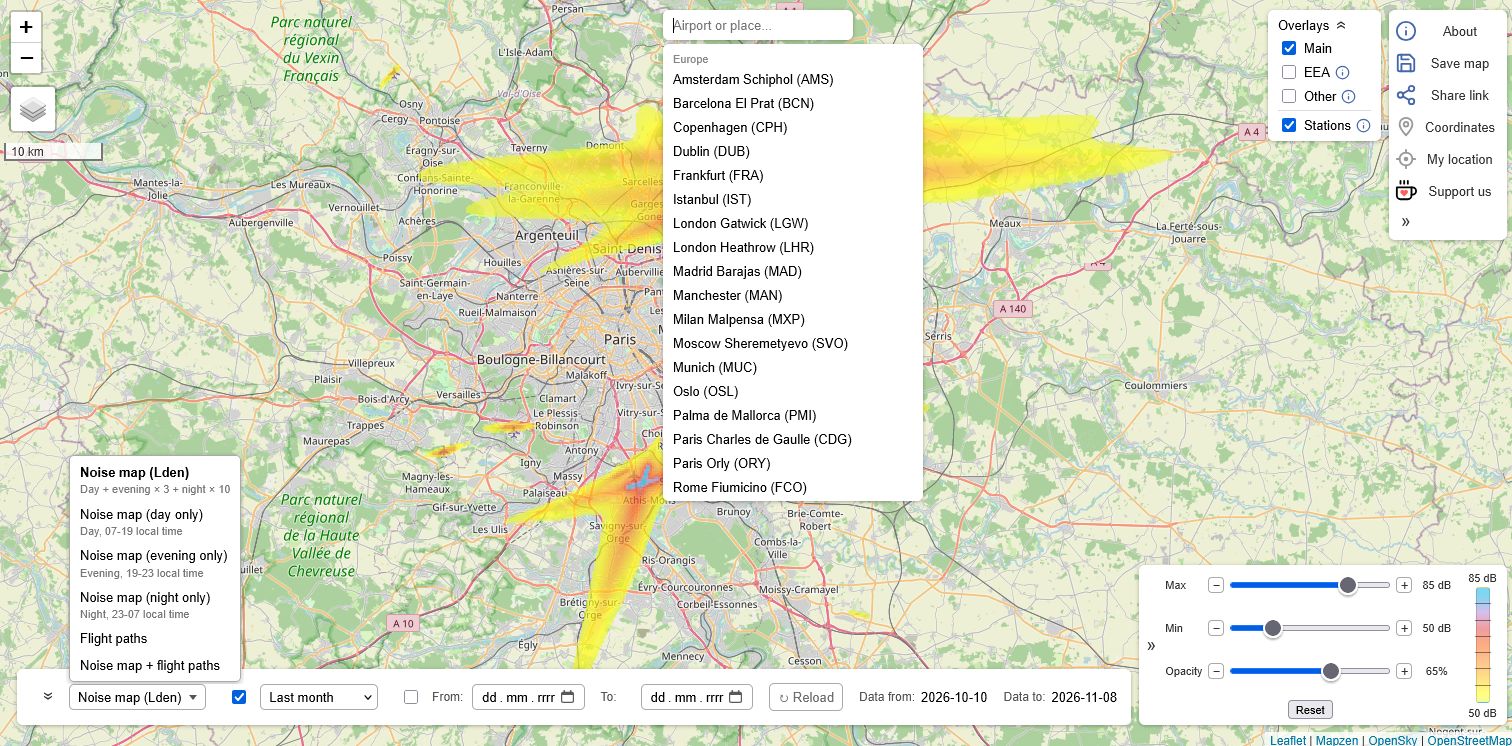
Using the map
 1
2
3
4
5
6
7
- View menu (bottom) - what the map shows
- Period (bottom) - which days
- Legend (bottom right) - the colour scale, and the range sliders when clicked
- Overlays (top right) - our map, official noise maps and measuring stations
- Search (top) - airports and places
- Base map (top left) - standard map or satellite
- Buttons (top right) - about, save, share, coordinates, my location, support
1What the map shows - views
The view menu at the bottom chooses one of these. The arrow next to it folds the other controls away; the view menu stays, so the view can still be changed (on a phone the controls start folded).
| View | What it shows |
|---|---|
| Noise map (Lden) | The noise on the ground from all flights as Lden, the day-evening-night level: the EU's official noise indicator (Environmental Noise Directive 2002/49/EC), used by the strategic noise maps EU countries report to the European Environment Agency, for an average day over the chosen period. |
| Noise map (day only) | The average level of the day hours alone, 07-19 local time (Lday). |
| Noise map (evening only) | The same for the evening, 19-23 (Levening). |
| Noise map (night only) | The same for the night, 23-07 (Lnight). |
| Flight paths | How many flights per day pass over each place: the same flights the noise map uses, counted in each 200 m cell they cross, as an average per day from one flight per week to 100 per day. |
| Noise map + flight paths | The noise map with the paths of 5 or more flights a day drawn over it in dark blue, faint at 5 a day and solid from 100 a day - which flights make the noise where. |
2Period
Last 3 days, week, month (the default) or 6 months - always whole UTC days, ending with the most recent calculated day. Or choose your own From / To days: as soon as both are set, the map switches to them and reloads. The map shows the average day of the period: a place overflown on one day of seven gets a seventh of that day's noise.
3Colours and the legend
The noise map uses the colours of official noise maps, one per 5 dB band, blended smoothly between the middles of the bands, with greens below 50 dB, where official maps stop; the same level always has the same colour. By default it shows 50 to 85 dB, the range of the official maps. Quieter places are not coloured.
Clicking the legend opens the range sliders: the levels (or flights per day) the colours cover - down to 45 dB, the World Health Organization's guideline level for aircraft noise (Lden), and below - and the opacity of the map's colours. In Noise map + flight paths the sliders set the noise map's levels; the paths always start at 5 flights a day, and follow the opacity.
4Official noise maps and stations - overlays
The Overlays panel at the top right shows one of these at a time, or none: Main (our noise map) or an official aircraft noise map, for comparison. Official maps are drawn in the same colours, so a colour means the same level on both, and they usually give Lden, as ours does. Each official map's area is outlined in red; outside it that map has no data. The info signs explain each overlay, with links to the sources.
| Overlay | What it shows |
|---|---|
| EEA | Strategic noise maps (Lden) that EU countries report to the European Environment Agency under the Environmental Noise Directive, around major airports. The latest ones mostly use 2021 traffic - a pandemic year with far fewer flights - so they often look quieter than today's noise. |
| Other | Official maps from other sources: Warsaw Chopin (City of Warsaw strategic noise map 2022), London Heathrow (England's round 4 strategic noise mapping, not in the EEA data), Madrid-Barajas and Munich (their 2017 maps, made with pre-pandemic traffic) and Paris CDG and Orly (Ile-de-France 2022 maps, with the Grand Paris map's 50-55 dB band). |
| Stations | On or off together with any of the above: official noise measuring stations around airports, each with the levels measured in its latest published month. |
5Search
The search box at the top lists the airports we show; typed into, it finds airports and places - towns, districts, streets and addresses - and moves the map there, marking the place found.
6Base map
The button at the top left switches between the standard map (OpenStreetMap) and satellite images (Esri World Imagery).
7Buttons on the right
| Button | What it does |
|---|---|
| About | This page. |
| Save map | Downloads the current view as a PNG image, with the view, the period and the map attribution printed on it. |
| Share link | Creates a link that opens the map at the same place and zoom, with the same view, period, base map and overlay (Main on or off). A relative period (e.g. "last week") stays relative, so the link always shows the latest data. |
| Coordinates | When switched on, clicking the map shows the coordinates of that point, ready to copy. |
| My location | Shows your current position on the map. |
| Support us | A way to support FlightNoise24 with a small donation. |
The arrow at the bottom of the column shows or hides the buttons' names.
How the noise map is calculated
The calculation follows the European standard method for airport noise maps, ECAC Doc 29 (in EU law as Directive 2015/996), as far as recorded flight positions allow. It is done for every UTC day, in these stages:
- Choosing the flights. Airliners and business jets are used; gliders, light aircraft, helicopters and ground vehicles are left out, and so are flights high enough to hardly matter for noise on the ground.
- Cleaning the data. Positions that are clearly wrong - impossible heights or speeds, receivers stuck on an old position, unreliable altitudes - are filtered out.
- Height above the ground. Each aircraft's height is measured from the terrain under it, from worldwide terrain data, not from sea level.
- Rebuilding the whole flight. From the recorded positions we rebuild each flight's full path, following its turns and completing the parts the receivers rarely see: the final approach, the landing and the take-off on the runway, where a flight is loudest.
- How loud each part of the flight is. As in Doc 29, the noise comes from the engine thrust each part of the flight needs - climbing, descending, accelerating, on the runway - and the official noise tables of the method's aircraft database.
- How the sound reaches the ground. The sound spreading with distance, its absorption in the air and its extra loss when it travels low over the ground are taken from the same method.
Positions carry no aircraft type, so a typical modern airliner is assumed for every flight. Larger or older aircraft are therefore louder than the map shows, and business jets and smaller aircraft quieter.
Day, evening and night - Lden
The noise is added up per 200 m cell separately for the day (07-19), evening (19-23) and night (23-07) in local time - the EU Environmental Noise Directive's default hours. Lden weights them like official noise maps do: evening noise counts +5 dB (3.16 times), night noise +10 dB (10 times), so one night flight counts as much as ten by day.
The views of a single period show the average level over its own hours.
Comparison with official airport noise maps
Airports and cities publish noise maps computed with certified models from their actual traffic, fleet and flight procedures. The noise map is calibrated on the official contours of Warsaw Chopin, London Heathrow, Munich, Madrid-Barajas and Paris-Orly, so that its contours enclose the same areas as the official ones, on average over all levels and airports.
Warsaw shows it in detail. The City of Warsaw's 2022 strategic noise map (Lden, 5 dB bands from 50 dB) against the noise map's average day for 1 October - 4 November 2026:
Cell by cell, in the official map's 50 dB and louder cells (the noise map minus the middle of the official band):
| Where | Mean difference | Mean size of the difference |
|---|---|---|
| Beside the runways, up to 2 km | -0.6 dB | 2.0 dB |
| Beside the runways, 2-5 km | 0.0 dB | 1.8 dB |
| Under the approach and departure paths, up to 5 km | +1.0 dB | 2.5 dB |
| Under the paths, 5-10 km | +0.4 dB | 1.7 dB |
| Under the paths, beyond 10 km | -4.9 dB |
Things to keep in mind:
- The loudest levels (70 dB and above) are 5-7 dB too low at Warsaw, right by the runways, where take-offs and landings dominate and the recorded data says least about them.
- Far along the paths the official map is louder. Its 50 dB area north-west of Chopin, over Wola and Bemowo, is hardly overflown in the October 2026 traffic.
- Different years. The official maps are from 2007-2022, with other traffic and, in the older ones, louder aircraft.
- Other traffic. The noise map includes every flight in the area, not only one airport's arrivals and departures, which mostly affects the quieter levels.
Comparison with official measuring stations
Many airports run permanent noise measuring stations around them and publish what they measure from aircraft alone (each recorded noise event matched to a flight, other sounds left out). These are real measurements of today's traffic, and the noise map was not calibrated on them, so they are an independent check. The noise map was compared with the monthly Lden of 107 station-months at six European airports:
| Airport | Stations | Months (2026) | Values (aircraft only) |
|---|---|---|---|
| Warsaw Chopin | 6 | August | day (06-22) and night (22-06) |
| Munich | 14 | September | Lden |
| Frankfurt | 25 | July | Lden |
| Zurich | 11 | August | day and night hours |
| Paris CDG, Orly, Le Bourget (Bruitparif) | 5-6 | July - October | Lden |
| Cologne/Bonn | 14-16 | July - August | Lden |
Where a station gives no Lden, it is estimated from its day and night values. Two further airports, outside Europe and not used for anything else, test the noise map where flights and procedures differ: Tokyo Narita (100 stations, Lden) and New York (30 Port Authority sites around JFK, LaGuardia, Newark and Teterboro; DNL, the US level with night +10 dB and no evening), both for August 2026.
- Over all 107 European station-months the noise map is +1.0 dB above the stations on average, with 3.2 dB as the typical size of the difference at a single station.
- Narita and New York come out right too (+0.4 and 0.0 dB on average) with the calibration done in Europe.
- The aircraft type matters: Teterboro's business jets are quieter than the typical airliner the map assumes, so its sites read 4-13 dB below the noise map; next to JFK and LaGuardia, with many large long-haul aircraft, the monitors within 1.5 km of the runways read 3-9 dB above it.
- Stations miss quiet aircraft. They only count noise events that stand out from other sounds, so far from the flight paths, on quiet days, they read lower than the noise map.
Field check near Warsaw
On 2 May 2026 we measured real overflights on the ground at two spots near the approach path of Warsaw Chopin Airport: the maximum level of each one (like Lmax), with the aircraft identified by its ADS-B transponder, with its reported altitude and speed, and compared them with the model's peak level for the same flight. Nothing in the model was fitted on these measurements.
| Spot | Time | Aircraft | Altitude | Speed | Measured | Model | Difference |
|---|---|---|---|---|---|---|---|
| Directly under the flight path background 42-43 dB |
16:09 | Airbus A321neo | 267 m | 272 km/h | 80.1 dB | 77.6 dB | -2.5 dB |
| 16:13 | Embraer E175 | 259 m | 240 km/h | 78.3 dB | 77.8 dB | -0.5 dB | |
| 16:16 | Airbus A321neo | 267 m | 264 km/h | 79.3 dB | 77.6 dB | -1.7 dB | |
| 16:22 | Boeing 737-800 | 259 m | 305 km/h | 81.1 dB | 76.8 dB | -4.3 dB | |
| 16:30 | Airbus A321neo | 260 m | 232 km/h | 76.8 dB | 77.8 dB | +1.0 dB | |
| 16:39 | Boeing 737-800 | 267 m | 277 km/h | 80.1 dB | 77.6 dB | -2.5 dB | |
| About 1.7 km from the aircraft, to the side of the path background 38-45 dB |
17:14 | Embraer E190 | 274 m | 227 km/h | 50.4 dB | 53.5 dB | +3.1 dB |
| 17:17 | Boeing 737-800 | 251 m | 281 km/h | 51.6 dB | 53.3 dB | +1.7 dB | |
| 17:22 | Airbus A321neo | 259 m | 268 km/h | 51.2 dB | 53.4 dB | +2.2 dB |
Under the path the model is 1.8 dB below the measurements on average, 1.7 km to the side 2.3 dB above them. The altitudes are as reported over ADS-B, and 30 m more or less changes the level under the path by about 1 dB.
Real measurements are also shaped by conditions the model leaves out. Wind carries sound further downwind and weakens it upwind, and can bend it towards or away from the ground. Buildings, trees and other obstacles can block sound or reflect it back, while terrain and the ground surface matter too - grass and soft soil absorb sound, hard surfaces reflect it, and hills can shield a spot completely. The same aircraft can therefore sound noticeably different at two nearby spots or on two different days. One session is not enough to judge the model's accuracy - more measurements are needed.
Data sources
| Source | Used for |
|---|---|
| OpenSky Network | Worldwide ADS-B flight positions |
| AWS Terrain Tiles (Mapzen; from SRTM, EU-DEM, GMTED, ETOPO1 and other sources), EGM96 geoid model (NGA) | Ground level |
| Commission Directive (EU) 2015/996 (ECAC Doc 29 method and its aircraft data) | The noise calculation method |
| OurAirports (public domain) | Runways |
| CAA ERCD Report 1601 (Heathrow 2015), Lärmkarte Flughafen München (CC BY-SA 3.0), AENA strategic noise map of Madrid-Barajas, Grand Paris Lden strategic noise map, City of Warsaw strategic noise map 2022 | Noise map comparison and calibration |
| Warsaw Chopin Airport, Munich Airport (TraVis), Fraport, Zurich Airport, Bruitparif (Ile-de-France), Köln Bonn Airport, Narita Airport, Port Authority of New York and New Jersey | Noise measuring stations: comparison (the stations shown on the map: Warsaw, Munich, Frankfurt and Zurich) |
| European Environment Agency (Environmental Noise Directive reporting), City of Warsaw, Defra (England), MITECO (Spain), Bayerisches Landesamt für Umwelt (CC BY 4.0), Bruitparif (Ile-de-France) | Official noise map overlays |
| OpenStreetMap, Esri World Imagery | Base maps |
| Photon by komoot, with OpenStreetMap data | Place search |